Overview
Comprehensive Dashboard
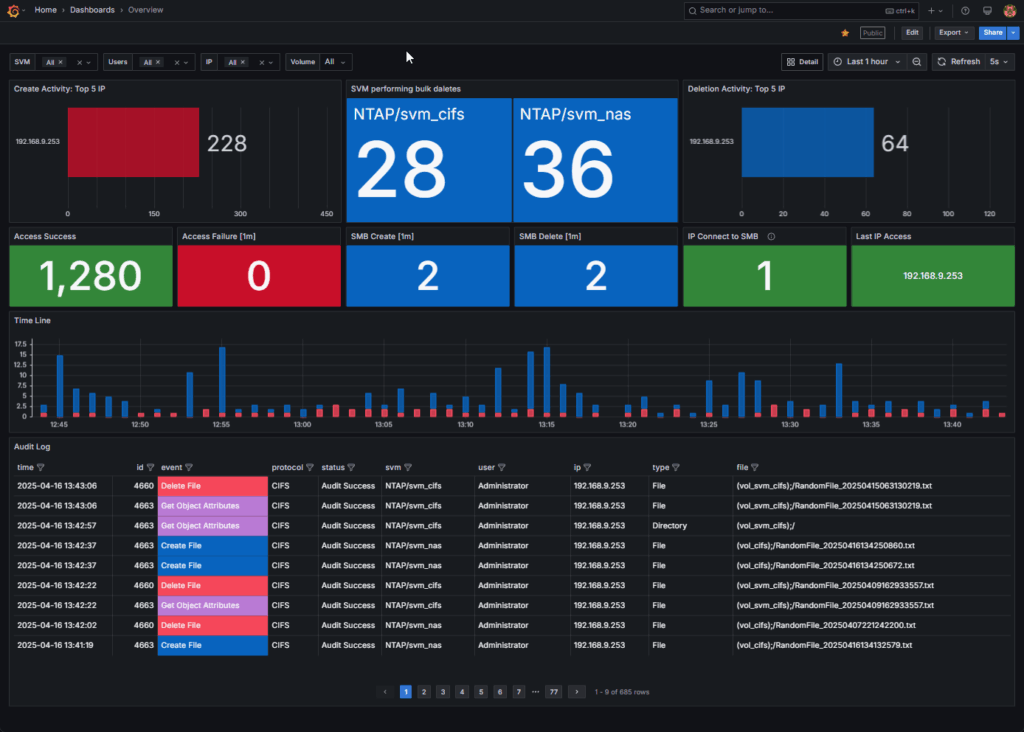
Our intuitive dashboard provides real-time insights into your data activities, making it easy to monitor and manage your ONTAP environments.
User-Friendly Interface: Navigate effortlessly through a clean and organized layout, allowing quick access to critical metrics.

Customize Your View
Select the filters you need to display only the metrics that matter to you.
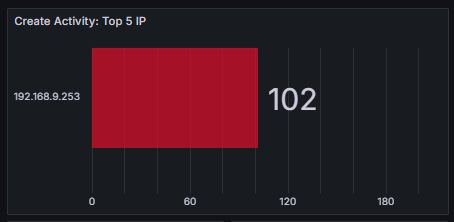
Create Activity: Top 5 IP
Top 5 IP addresses responsible for the highest number of “create” actions within the selected timeframe.
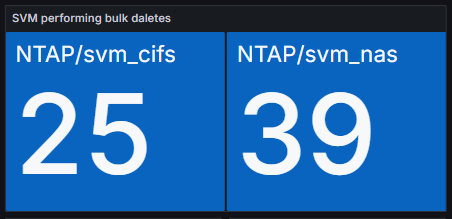
SVM performing bulk daletes
Displays the count of bulk delete actions executed by each SVM.
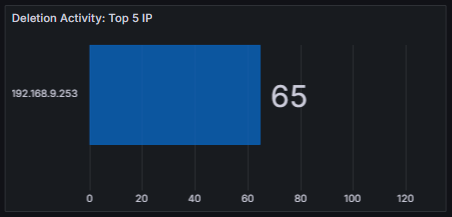
Deletion Activity: Top 5 IP
Top 5 IP addresses responsible for the highest number of “delete” actions within the selected timeframe.

File and Access Activity
Access Attempt Status: Shows the count of successful and failed attempts to access files and directories.
SMB File Operations (Create/Delete): Displays the count of SMB file creation and deletion events.
Client IP Connections: Number of connection attempts initiated by specific client IP addresses.
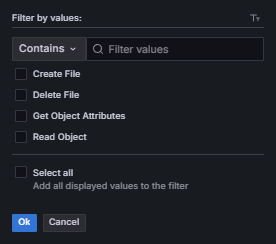
Filter by values
Refine your view by selecting specific values within each column to focus on the data you need.
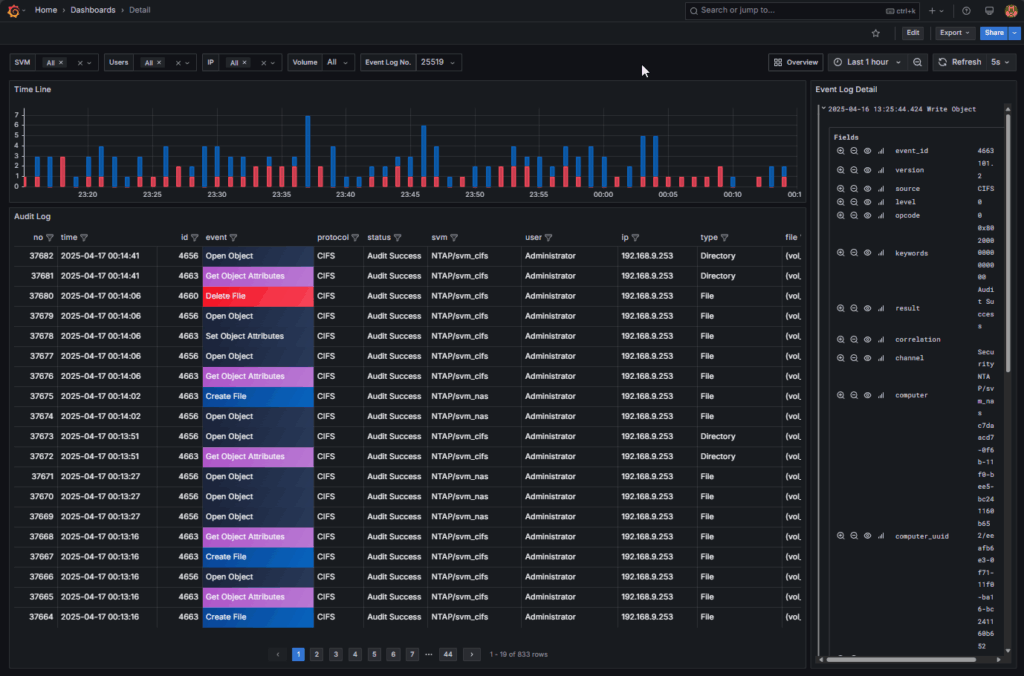
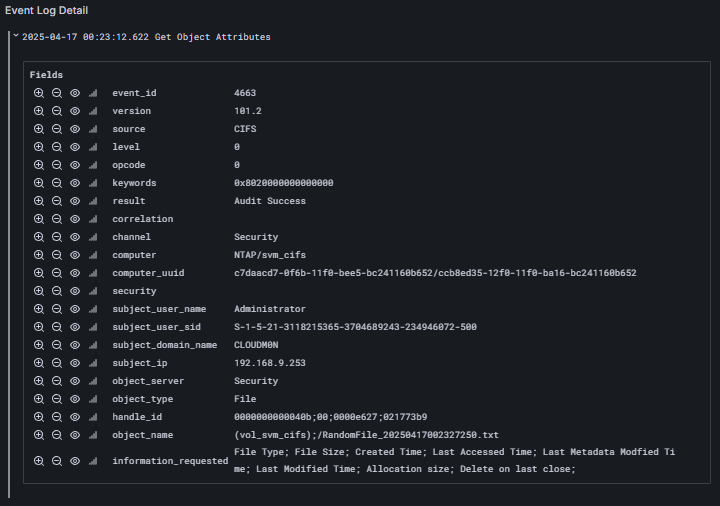
Detailed Event View
Select specific events to display detailed information.
Use the “Event Log No.” search bar to instantly find and view all detailed logs associated with a particular event identifier.
Filter by values
Explore comprehensive information for each logged event, including timestamps, IDs, protocols, status, involved servers (SVMs), users, source IPs, file paths, and specific event attributes, providing a granular view of system activity
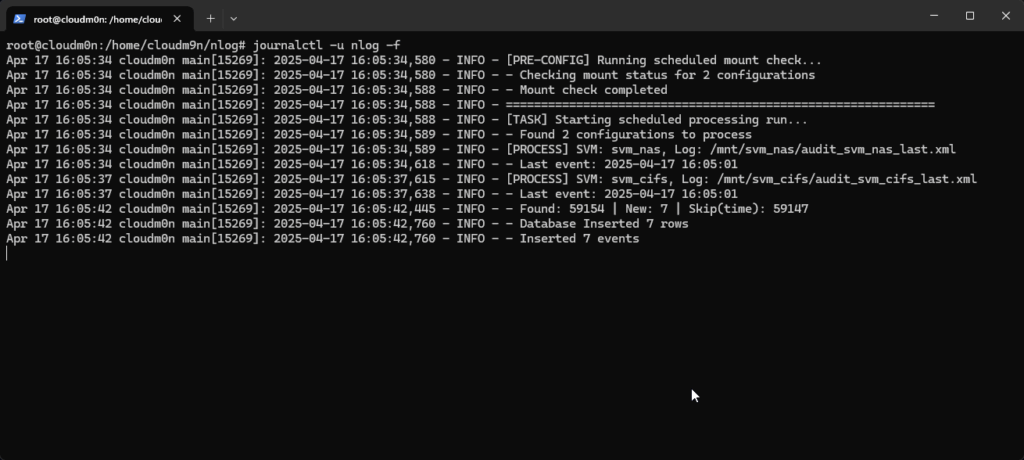
nlog Activity Log
Displays the current activity and logs of the nlog service
This section shows the live output of the nlog service, indicating its progress in tasks like mount checks, configuration processing for SVMs, and database interactions (inserting events).